
Infographics
Infographics Resources
Simplify complex data. Explore KDAPT's infographics to see how our platform transforms scattered information into clear, visual stories, making insights easier to understand, share, and act upon.

Category: KDAPT Roles
Roles & Privileges of KDAPT
Define how users interact with KDAPT by assigning roles tailored to their responsibilities. Each role
...
Read more
Category: KDAPT
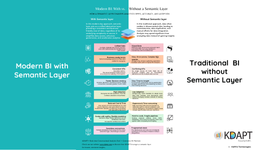
BI: With vs Without a Semantic Layer
To see the difference, check out how BI works with and without a semantic layer. Without it, analytics is slow
...
Read more